OpenTelemetry
The zero-cache service embeds the JavaScript OTLP Exporter and can send logs, traces, and metrics to any standard otel collector.
To enable otel, set the following environment variables then run zero-cache as normal:
OTEL_EXPORTER_OTLP_ENDPOINT="<your otel endpoint>"
OTEL_EXPORTER_OTLP_HEADERS="<auth headers from your otel collector>"
OTEL_RESOURCE_ATTRIBUTES="<resource attributes from your otel collector>"
OTEL_NODE_RESOURCE_DETECTORS="env,host,os"Grafana Cloud Walkthrough
Here are instructions to setup Grafana Cloud, but the setup for other otel collectors should be similar.
- Sign up for Grafana Cloud (Free Tier)
- Click Connections > Add Connection in the left sidebar
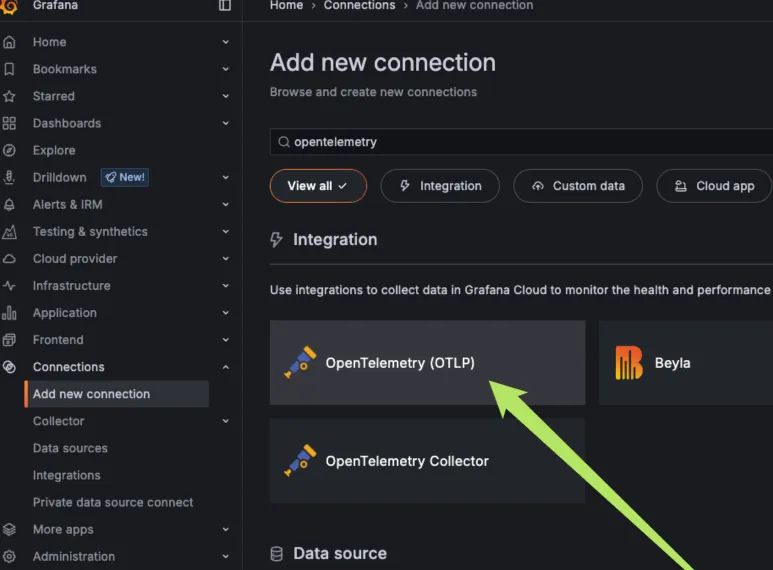
- Search for "OpenTelemetry" and select it
- Click "Quickstart"
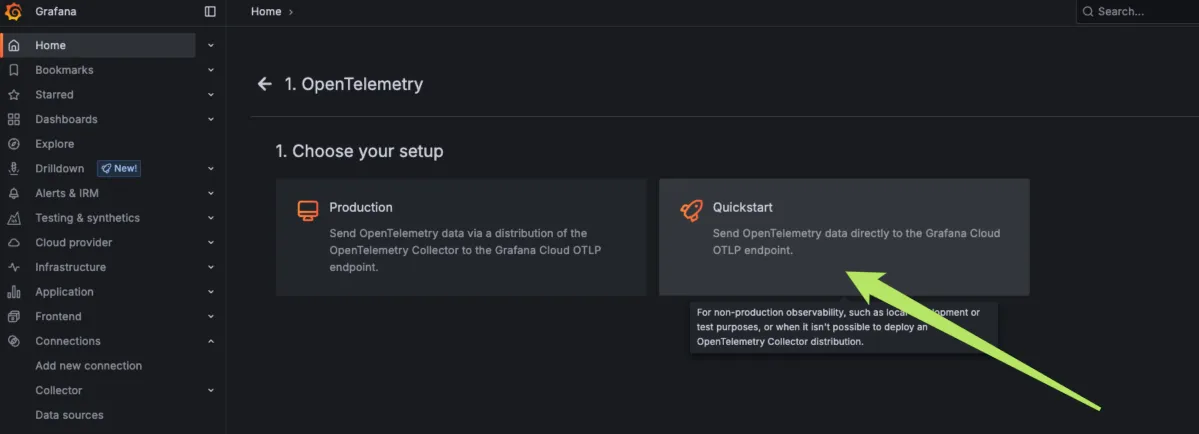
- Select "JavaScript"
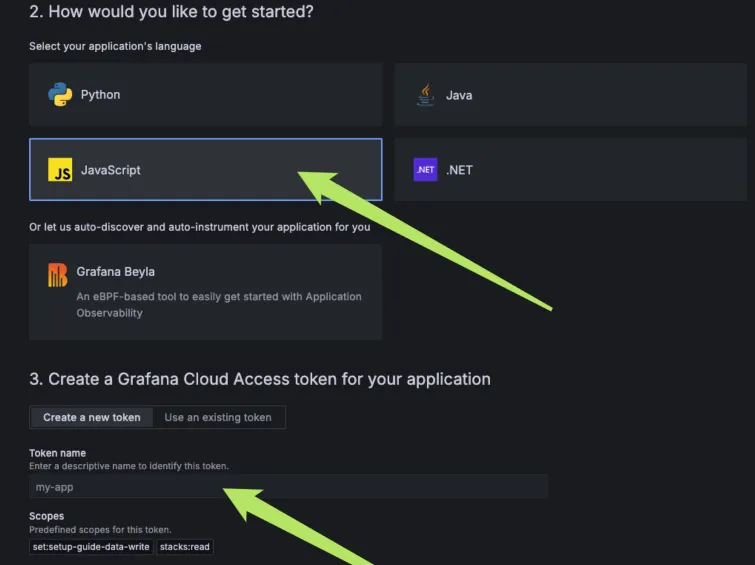
- Create a new token
- Copy the environment variables into your
.envfile or similar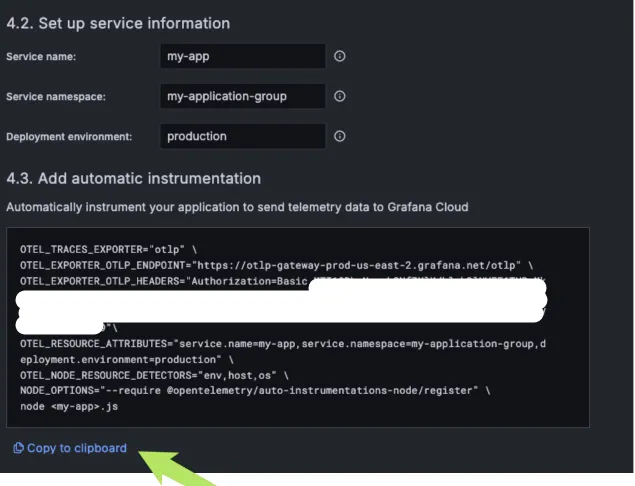
- Start
zero-cache - Look for logs under "Drilldown" > "Logs" in left sidebar
Distributed Tracing
You can enable end-to-end trace correlation from your frontend through zero-cache to your API server. This allows you to see the full request flow in your tracing UI.
To enable this, provide a getTraceparent callback when creating your Zero client:
import {ZeroProvider} from '@rocicorp/zero/react'
import {propagation, context} from '@opentelemetry/api'
function getTraceparent() {
const carrier: Record<string, string> = {}
propagation.inject(context.active(), carrier)
return carrier.traceparent
}
return (
<ZeroProvider
/* ... other options ... */
getTraceparent={getTraceparent}
>
<App />
</ZeroProvider>
)This callback is called before sending WebSocket messages that trigger API server calls (push, changeDesiredQueries, initConnection). The returned W3C traceparent header is forwarded through zero-cache to your API server, where it can be used to continue the trace.
Metrics Reference
zero.server
| Metric | Type | Unit | Description |
|---|---|---|---|
uptime | Gauge | s | Cumulative uptime, starting from when requests are served |
api.requests | Counter | API requests to user mutate, query, cleanup, and auth endpoints | |
api.request_duration | Histogram | s | End-to-end API request duration, including retries |
api.attempts | Counter | HTTP fetch attempts made while calling user API endpoints | |
api.attempt_duration | Histogram | s | API HTTP fetch attempt duration, excluding retry sleep |
api.in_flight | UpDownCounter | API requests currently in flight | |
startup_duration | Histogram | s | Duration from starting zero-cache to its ready signal |
worker_startup_duration | Histogram | s | Duration from starting a worker to its ready signal |
zero.replica
| Metric | Type | Unit | Description |
|---|---|---|---|
db_size | Gauge | bytes | Size of the replica's main db file (excludes WAL) |
wal_size | Gauge | bytes | Size of the replica's WAL file |
wal2_size | Gauge | bytes | Size of the replica's WAL2 file (only if using wal2 mode) |
backup_lag | Gauge | ms | Time since last litestream backup. Expected to sawtooth from 0 to ZERO_LITESTREAM_INCREMENTAL_BACKUP_INTERVAL_MINUTES |
purge_blocked | Counter | Number of change-log purges blocked because the actual backup state could not be verified or is stale | |
litestream.restore.runs | Counter | Litestream restore runs | |
litestream.restore.attempts | Counter | Litestream restore subprocess attempts | |
litestream.restore.db_bytes | Counter | bytes | SQLite database bytes restored by successful Litestream restores |
litestream.restore.duration | Histogram | s | Wall-clock duration of Litestream restore runs |
litestream.restore.wait_duration | Histogram | s | Time spent waiting for replication-manager snapshot status before restoring |
litestream.restore.process_duration | Histogram | s | Wall-clock duration of Litestream restore subprocesses |
litestream.restore.validation_duration | Histogram | s | Time spent validating restored replica databases |
litestream.backup.process_runs | Counter | Litestream backup process exits | |
litestream.backup.process_duration | Histogram | s | Runtime duration of Litestream backup subprocesses before they exit |
litestream.backup.list_duration | Histogram | s | Duration of Litestream backup destination listing commands |
litestream.backup.verification_duration | Histogram | s | Duration of verifying actual backup state in the backup destination |
litestream.snapshot.reservation_duration | Histogram | s | Duration of snapshot reservations while view-syncers restore and subscribe |
zero.replication
| Metric | Type | Unit | Description |
|---|---|---|---|
upstream_lag | Gauge | ms | Latency from sending a replication report to receiving it in the stream |
replica_lag | Gauge | ms | Latency from receiving a replication report to it reaching the replica |
total_lag | Gauge | ms | End-to-end replication latency. Grows as an estimate if the next report hasn't arrived |
last_total_lag | Gauge | ms | End-to-end latency of the most recently received report. Unlike total_lag, does not grow if reports stop arriving |
events | Counter | Number of replication events processed | |
transactions | Counter | Count of replicated transactions | |
changes | Counter | Count of replicated changes, including DML and DDL statements | |
slot_health | Gauge | 1 | Health of the active logical replication slot. Uses slot and status attributes |
slot_retained_wal_bytes | Gauge | bytes | WAL bytes retained by the active logical replication slot |
slot_safe_wal_bytes | Gauge | bytes | WAL bytes the active logical replication slot can retain before loss |
initial_sync_runs | Counter | Number of initial-sync runs | |
initial_sync_duration | Histogram | s | Wall-clock duration of an initial-sync run |
initial_sync_copy_duration | Histogram | s | Wall-clock duration of the COPY phase for a successful initial-sync run |
initial_sync_copy_other_duration | Histogram | s | Initial-sync duration excluding SQLite flush and index time for a successful run |
initial_sync_flush_duration | Histogram | s | Total SQLite flush time for a successful initial-sync run |
initial_sync_index_duration | Histogram | s | SQLite index creation time for a successful initial-sync run |
initial_sync_rows | Counter | Rows copied during successful initial-sync runs | |
initial_sync_copy_stream | Counter | bytes | PostgreSQL COPY stream bytes processed during initial sync, including in-progress and failed runs |
initial_sync_completed_copy_stream | Counter | bytes | PostgreSQL COPY stream bytes processed during successful initial-sync runs |
initial_sync_copy_chunks | Counter | PostgreSQL COPY stream chunks processed during initial sync | |
shadow-sync-runs | Counter | Number of shadow initial-sync runs | |
shadow-sync-duration | Histogram | s | Wall-clock duration of a shadow initial-sync run |
flow_control.active_subscribers | Gauge | Active change-stream subscribers receiving live changes | |
flow_control.queued_subscribers | Gauge | Change-stream subscribers waiting for the current transaction to finish before activation | |
flow_control.pending_messages | Gauge | Downstream change-stream messages not yet acknowledged by subscribers | |
flow_control.backlog_messages | Gauge | Live change-stream messages buffered while subscribers catch up | |
flow_control.backlog_bytes | Gauge | bytes | Live change-stream bytes buffered while subscribers catch up |
flow_control.max_backlog_bytes | Gauge | bytes | Maximum live change-stream bytes buffered by a single subscriber |
flow_control.waits | Counter | Completed flow-control checkpoints | |
flow_control.wait_duration | Histogram | s | Time replication waits at flow-control checkpoints |
zero.sync
| Metric | Type | Unit | Description |
|---|---|---|---|
max-protocol-version | Gauge | Highest sync protocol version seen from connecting clients | |
active-clients | UpDownCounter | Number of currently connected sync clients | |
active-client-groups | Gauge | Number of active ViewSyncerService instances in a syncer worker | |
queries | Gauge | Active IVM pipelines across all client groups in a syncer worker | |
rows | Gauge | CVR-tracked rows across all client groups in a syncer worker | |
serving_lag | Gauge | ms | Maximum time active ViewSyncer client groups have had replica changes ready locally but not yet served to clients |
serving_lag_stats | Gauge | ms | Distribution of serving lag across active ViewSyncer client groups |
serving_lagging_client_groups | Gauge | Number of active ViewSyncer client groups with replica changes ready locally but not yet served to clients | |
view_syncer_lag | Histogram | s | Lag from replica-ready changes to ViewSyncer output for active client groups |
view_syncer_hydration | Histogram | s | Time from ViewSyncer query sync requiring hydration to output for a client group |
lock-wait-time | Histogram | s | Time spent waiting to acquire the ViewSyncerService lock per operation |
pipeline-resets | Counter | Count of pipeline resets | |
hydration | Counter | Number of query hydrations | |
hydration-time | Histogram | s | Time to hydrate a query |
advance-time | Histogram | s | Time to advance all queries for a client group after applying a transaction |
poke.time | Histogram | s | Time per poke transaction (excludes canceled/noop pokes) |
poke.transactions | Counter | Count of poke transactions | |
poke.rows | Counter | Count of poked rows | |
cvr.load_attempts | Counter | CVR load attempts | |
cvr.load_duration | Histogram | s | Time to load a CVR |
cvr.flush_attempts | Counter | CVR flush attempts | |
cvr.flush-time | Histogram | s | Time to flush a CVR transaction |
cvr.rows-flushed | Counter | Number of changed rows flushed to a CVR | |
websocket.open_connections | UpDownCounter | Open client WebSocket connections | |
websocket.connection_attempts | Counter | Client WebSocket connection attempts | |
websocket.connection_successes | Counter | Client WebSocket connections successfully initialized | |
websocket.connection_failures | Counter | Client WebSocket connection attempts that failed before initialization | |
websocket.errors | Counter | Client WebSocket error events | |
ivm.advance-time | Histogram | s | Time to advance IVM queries in response to a single change |
ivm.conflict-rows-deleted | Counter | Rows deleted because they conflicted with an added row | |
query.transformations | Counter | Number of query transformations performed | |
query.transformation-time | Histogram | s | Time to transform custom queries via API server |
query.transformation-hash-changes | Counter | Times a query transformation hash changed | |
query.transformation-no-ops | Counter | Times a query transformation was a no-op | |
query.row-set-signature-drifts | Counter | Times unchanged query rehydration produced a different row-set signature than the CVR, forcing a config-version bump |
zero.mutation
| Metric | Type | Unit | Description |
|---|---|---|---|
crud | Counter | Number of CRUD mutations processed | |
custom | Counter | Number of custom mutations processed | |
pushes | Counter | Number of pushes processed |